Accuracy, Precision, Recall
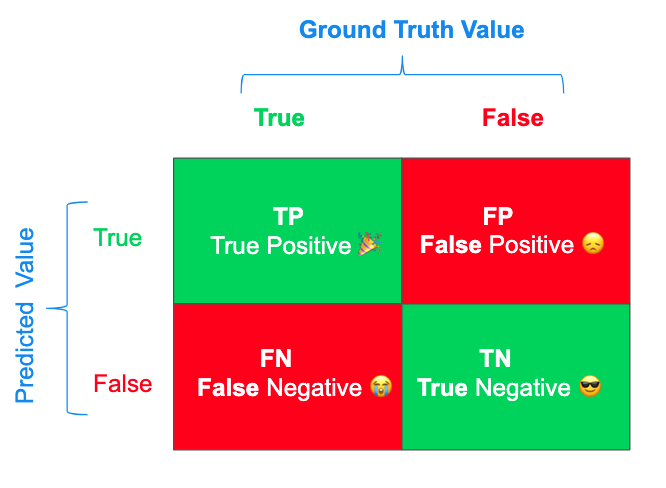
Confusion matrix for binary classification
binary classification의 결과를 평가하기위해 사용하는 metric이다.
accuracy = true positive + true negative / (all types)
–> “모든 cases들 중에 true로 (맞게) 예측한 경우”
number of correct predictions over the output size
precision = true positive / (true positive + false positive)
–> “positive로 예측한것들 중에 맞게 예측한 경우”
특정 domain에서는 false positive가 false negative를 얻는것보다 더 치명적인 에러이다. (e.g. spam detection - 매우 중요한 이메일을 spam으로 잘못 구분하여 못보는것이 spam 이메일 하나가 inbox에 잘못 들어오는것 보다 더 큰 에러임.)
만약 precision이 accuracy보다 낮은 경우, false positive가 현재 가지고있는 에러의 큰 비중을 차지하고 있을 수 있다. (The greater false positive will render greater denominator, hence smaller precision value.)
recall = true positive / (true positive + false negative)
–> “실제 positive인것들 중에 맞게 예측한 경우”
Precision과는 “반대”를 의미한다고 볼 수 있다. False negative vs. true positive를 보여주는 metric이다. 병에 걸렸는데에도 안결린것으로 잘못 예측하는 false negative가 더 치명적인 error인 안전과 같은 문제에서 매우 critical한 평가 metric이다. 그래서 disease diagnosis와 같은 문제에서는 recall이 accuracy or precision보다 높은 결과를 선호한다.
precision-recall curve
unbalanced dataset이 주어진 경우, precision과 recall 사이의 tradeoff를 보여주는 유용한 metric이다. (when one class is dominant while the other class is under represented in the dataset)
f1-score = 2 * [ (recall*precision)/(recall + precision) ]
만약 precision과 recall 모두 높은 값을 얻어야한다면, recall과 precision의 harmonic mean인 f1-score를 통해 판단할 수 있다. recall과 precision의 average보다 harmonic mean은 outliers 덜 민감하다. F1-score는 여러 domain에서 적합한 평가 metric으로 활용되고있다.
“The F1-score is a balanced metric that appropriately quantifies the correctness of models across many domains.”
ROC(Receiver Operating Characteritics) & AUC(area under the curve)
AUC는 ROC curve아래의 면적을 의미하고, ROC는 TPR(Recall)과 FPR(1-specificity) 사이의 tradeoff를 표현해준다.
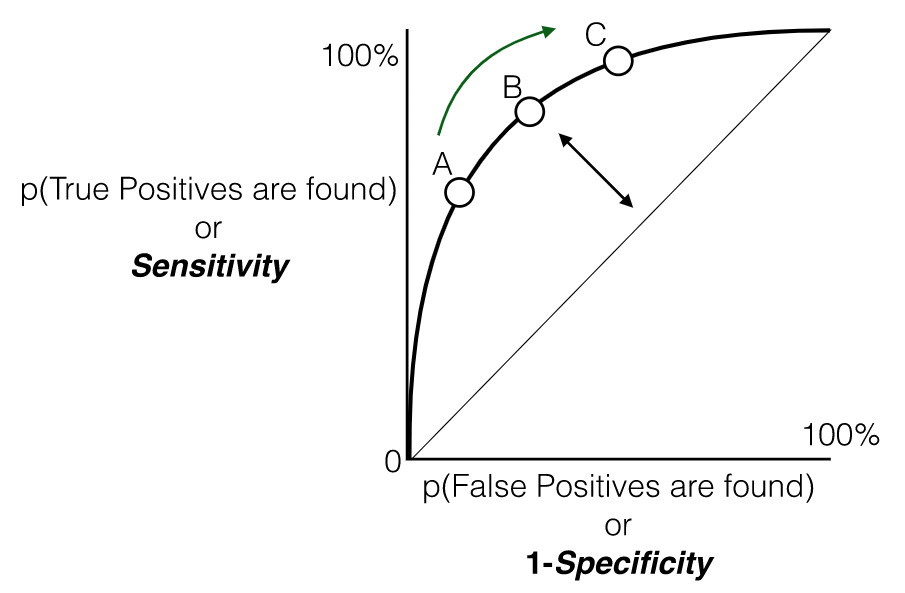
TPR (True Positive Rate)은 recall과 같고 sensitivity로도 불린다.
TPR = true positive / (true positive + false negative)
FPR (False Positive Rate)은 (1-specificity)이며 다음과 같다:
FPR = false positive / (false positive + true negative)
–> “실제 negative인것들 중에 맞게 예측한 경우”
FPR은 classifier model의 “false alarm metric”이다. 이 metric은 얼마나 자주 classifier가 negative여야하는 case를 positive로 잘못 예측하는지를 알려준다.
Precision-recall curve와는 다르게 ROC(receiver operator characteristic) curve는 balanced dataset의 domain에 적합하다. ROC곡선을 보면 TPR(recall)이 높을수록 분류기가 만드는 FPR이 늘어난다.
AUC의 값은 다른 metric과 동일하게 ranges over 0 and 1.
AUC=0.5의 경우는 아래 grpah에서 diagonal line을 의미하며 random prediction expected value로 여겨진다. 성능이 좋은 분류기일수록 이 diagonal line에서 최대한 멀리 떨어져있어야한다. (AUC가 1에 가까워짐.)
precision-recall curve vs. ROC(FPR-TPR curve)
이 두가지 curve중 어떤것을 사용해야할까?
일반적으로는 positive class가 드물거나(unbalanced dataset) 또는 false negative보다 false positive가 더 중요할때에 precision-recall curve를 사용하고, 그렇지 않으면 ROC를 사용한다.
Unbalanced dataset의 경우에는 위 graph와 같이 낮은 FPR에서도 높은 TPR이 확보되는 경우(negative sample들이 positive samples보다 훨씬 많기때문에, true negative가 크고 false negative는 낮아서) AUC값이 높고, 좋은 분류기라고 판단할 수 있지만, precision-recall curve를 보면 분류기의 성능 개선 여지가 얼머나 있는지 더 정확하게 확인할 수 있다.
Metrics for other classification
multiple class들을 예측해야하는 경우, accuracy는 다음과 같이 찾을 수 있다.
accuracy = correct predictions / all predictions
# Accuracy for non-binary predictions
def my_general_accuracy_score(actual, predicted):
    correct = len([a for a, p in zip(actual, predicted) if a == p])
    wrong = len([a for a, p in zip(actual, predicted) if a != p])
    return correct / (correct + wrong)
precision과 recall은 false positive와 negative를 측정해기때문에 다음과 같이 general classifier에 해당할 수 있도록 precision값을 찾을 수 있다.
def my_general_precision_score(actual, predicted, value):
    true_positives = len([a for a, p in zip(actual, predicted) if a == p and p == value])
    false_positives = len([a for a, p in zip(actual, predicted) if a != p and p == value])
    return true_positives / (true_positives + false_positives)
만약 discrete categories or classes가 아닌, continuous prediction이 요구되는 domain이라면, threshold parameter를 설정해서 continuous prediction에 대한 accuracy를 계산할 수 있다. (해당 domain knowledge를 기반으로 적절한 threshold가 설정되어야 함.)
# Accuracy for continuous with threshold
def my_threshold_accuracy_score(actual, predicted, threshold):
    a = [0 if x >= threshold else 1 for x in actual]
    p = [0 if x >= threshold else 1 for x in predicted]
    return my_accuracy_score(a, p)
Reference
- A Pirate’s Guide to Accuracy, Precision, Recall, and Other Scores by Philip Kiely. Oct 2019, from https://blog.floydhub.com/a-pirates-guide-to-accuracy-precision-recall-and-other-scores/
- Geron, Aurelien. Hands on Machine Learning. O’Reilly, 2019