Imbalanced classification metrics
Optimal threshold & ROC
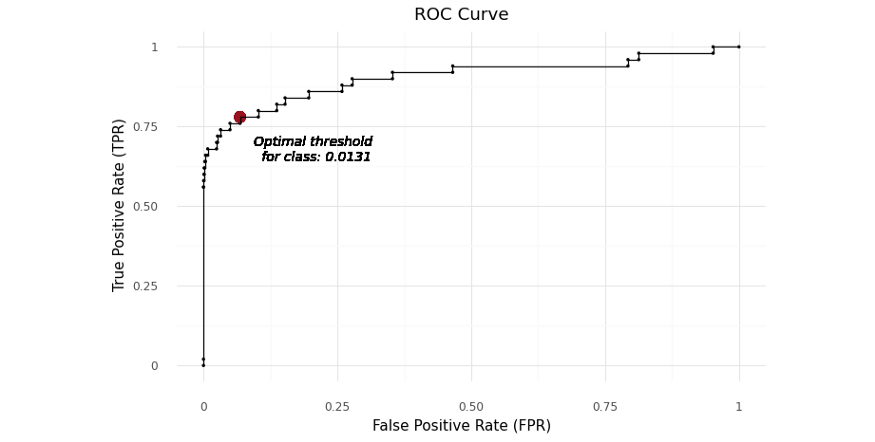
The X-axis or independent variable is the false positive rate for the predictive test. The Y-axis or dependent variable is the true positive rate for the predictive test. A perfect result would be the point (0, 1) indicating 0% false positives and 100% true positives.
FPR과 TPR을 하나의 metric으로 measure하기위해 이 둘의 G-Mean(geometric mean) 지표를 사용할 수 있다.
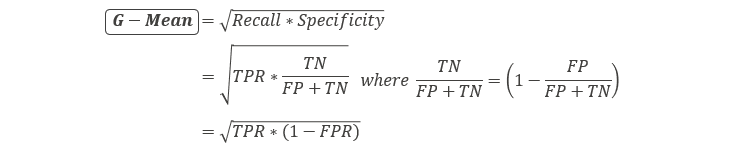
optimal threshold는 highest G-mean score를 얻는 point에서 찾을 수 있다. Theoretically, the observation will be categorized as a minor class when its probability is lower than 0.0131, vice versa.
model.predict_proba()와 같은 함수를 통해서 한 sample의 분류 클래스를 predict하는 확률이 0.0131보다 낮은경우 해당 sample을 minority class로 분류하는 것이다.
Youden’s J statistic
Youden’s J statistics를 optimize해서 classification의 best threshold를 찾을 수 있다.
Youden’s J는 TPR과 FPR의 차이값을 가장 클때의 threshold를 최적의 값으로 지정한다.
# Calculate the Youden's J statistic
youdenJ = tpr - fpr

# Find the optimal threshold
index = np.argmax(youdenJ)
thresholdOpt = round(thresholds[index], ndigits = 4)
youdenJOpt = round(gmean[index], ndigits = 4)
fprOpt = round(fpr[index], ndigits = 4)
tprOpt = round(tpr[index], ndigits = 4)
Precision-Recall curve
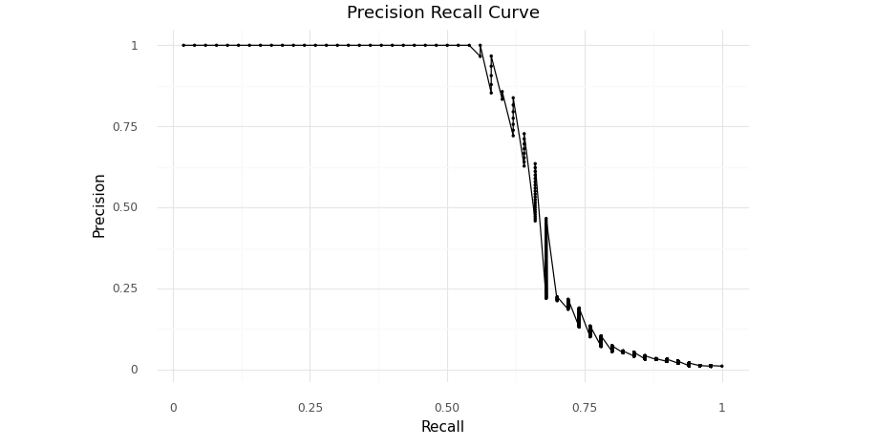
precision-recall 값을 사용해서 계산하는 F-1 score값이 최대값일때의 threshold값을 최적의 값으로 찾을 수 있다. 단지, 앞에서 ROC와 G-Mean을 기준으로 찾은 값과 차이가 난다.
Threshold tuning
앞에서는 ROC 또는 Precision & Recall를 사용해서 계산한 sequence of threshold를 사용했지만, threshold tuning 방법에서는 필요한 sequence of threshold값을 직접 생성해서 최적화에 적용할 수 있다. Threshold customization이 가능하지만, 앞의 방법들 보다 computation cost가 더 높다.
References
- https://towardsdatascience.com/optimal-threshold-for-imbalanced-classification-5884e870c293
- https://machinelearningmastery.com/threshold-moving-for-imbalanced-classification/