Processing Missing Data
현실적인 데이터 셋을 다루게되면 여러가지 원인으로 corrupted dataset을 분석해야하는 경우가 발생하는데, 여러 경우 중 적지않은 양의 missing values(누락값)을 마주치게되는 문제는 매우 자주 많이 발생하는 이슈이다. 누락값은 처음부터 누락값이 있는 데이터를 불러오거나 데이터연결, 입력 등의 과정에서 생길 수 있다.
Missing value는 0,’ ‘과 같은 값과는 다른 개념이다. 데이터 자체가 없다는 것을 의미한다. 그래서 같다는 개념도 없다.
Python의 numpy 라이브러리에서 NaN, NAN, nan을 import해서 누락값 NAN과 True, False, 0, ‘ ‘을 비교하면 모두 False이다.
Python에서는 pandas 라이브러리의 isnull() 또는 notnull() method를 사용해서 누락값이지 여부를 확인할 수 있다. data set에서 dataframe.isnull().sum() 명령을 통해서 해당 dataframe안의 missing values의 갯수를 확인할 수 있다.

누락값의 유형
Missing Data의 유형은 크게 3 가지로 나눌 수 있다:
MAR(Missing at Random): missing value가 전체에서 자치하는 비율과 값이 있는 데이터 (observed data) 사이의 관계가 존재한다. (e.g., 특정 제품의 제조년도가 빠를수록 누락값이 더 많은 경우)
Missing values depend only on observed values. Probability of being missing is the same ONLY within groups defined by the observed data.
Missing value를 가진 데이터를 분류하는 가장 broad한 유형이다. MAR is more general and more realistic than MCAR. Modern missing data methods generally start from the MAR assumption.
예시:
1) When placed on a soft surface, a weighing scale may produce more missing values than when placed on a hard surface. If, however, we know surface type and if we can assume MCAR within the type of surface, then the data are MAR.
2) When we take a sample from a population, where the probability to be included depends on some known property.
MCAR(Missing Completely at Random): missing value가 전체에서 자치하는 비율이 다른 데이터값들과 아무런 관련이 없다. (e.g., 갑자기 정전으로 인해 설비가 멈추어서 데이터가 record되지 못한 경우)
Missing values are independent of any other values. Probability of being missing is the same for all cases, so causes of the missing data are unrelated to the data. 그래서 일반적으로 missing value로 인한 complexity를 ignore할 수 있고, missing value를 가진 sample을 data set에서 제외하여 분석을 진행한다.
예시:
A weighing scale that ran out of batteries. Some of the data will be missing simply because of bad luck. Another example is when we take a random sample of a population, where each member has the same chance of being included in the sample.
MNAR(Missing Not at Random): missing values가 우리가 알지 못하는 요인과 연관되어있다. 자칫하면 MCAR로 판단하여 missing data를 처리해버릴 수도 있지만, 먼저 MNAR을 의심하고 가능한 원인을 찾아낸는것이 필요하다. (e.g., 설비 노후로 인하여 점점 더 많은 missing values가 발생하는 경우)
Missing values depend on both observed and unobserved values. Probability of being missing varies for reasons that are unknown to us.
예시:
The weighing scale mechanism may wear out over time, producing more missing data as time progresses, but we may fail to note this. If the heavier objects are measured later in time, then we obtain a distribution of the measurements that will be distorted. MNAR includes the possibility that the scale produces more missing values for the heavier objects (as above), a situation that might be difficult to recognize and handle.
pandas로 data load 후, 다음과 같이 간단하게 pandas dataframe의 함수를 사용해서 데이터의 형태/분포/missing values를 quick하게 확인할 수 있다.
import pandas as pd

df = pd.read_csv('train_subset.csv')

# pandas로 읽은 dataset의 column들의 statistical summary & information & null value를 가진 instance의 갯수를 확인할 수 있다.
df.describe()
df.info()
df.isna().sum()
어떤 유형의 missing data인지를 파악하기위해 시각화 방법을 사용할 수 있다.
missingno 라이브러리를 import해서 missingno.matrix(dataframe) 명령을 통해 매트릭스 그래프로 dataframe의 missing data를 빈공간으로 시각화할 수 있다. 그리고 missingno.bar(dataframe) 명령을 통해 column별 bar graph로 missing data의 proportion을 확인할 수 있다.
Missing data visualization - 다음과 같이 Barplot, Matrix plot, heatmap, dendrogram plot을 통해서 dataset의 completeness를 시각적으로 확인할 수 있다.
Barplot
import missingno as msno

msno.bar(df)
Each bar represents a column within the dataframe. The height of the bar indicates how complete that column is (how many non-null values are present)
On the left side of the plot, the y-axis scale ranges from 0.0 to 1.0, where 1.0 represents 100% data completeness. If the bar is less than this, it indicates that we have missing values within that column.
On the right side of the plot, the scale is measured in index values. With the top right representing the maximum number of rows within the dataframe.

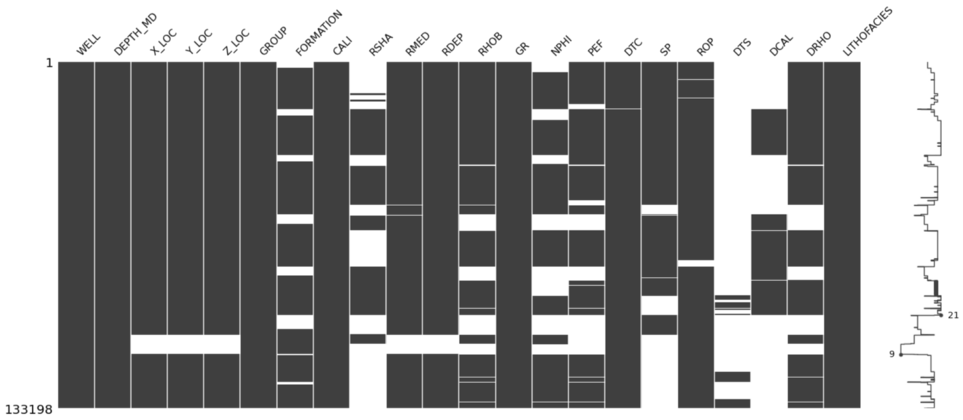
Matrix plot
msno.matrix(df)
depth-related data 또는 time-series data를 다룰때에 matrix plot이 유용한다. When data is present, the plot is shaded in grey (or your colour of choice), and when it is absent the plot is displayed in white.
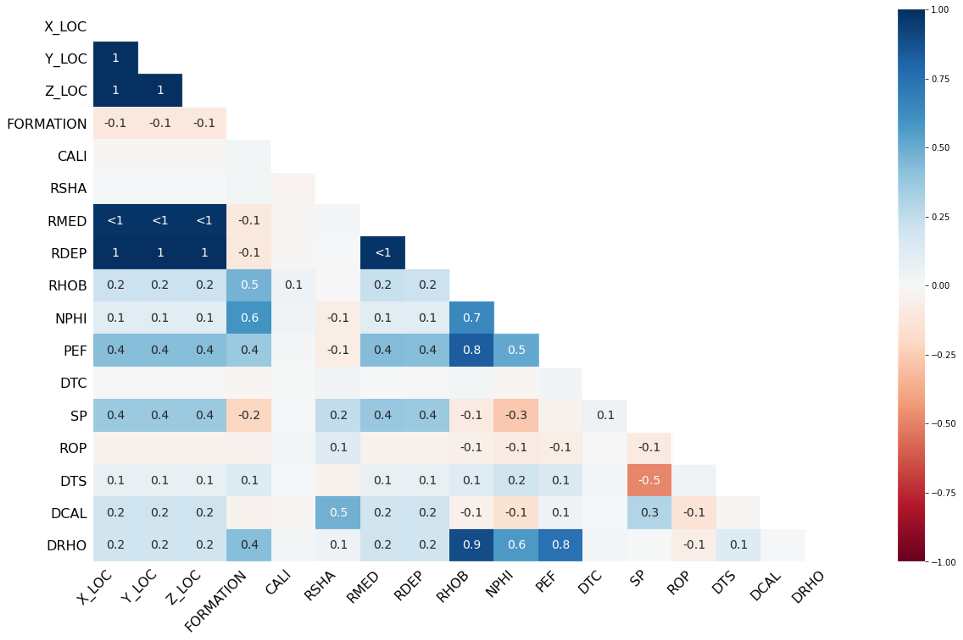
Heatmap
msno.heatmap(df)
The heatmap is used to identify correlations of the nullity between each of the different columns. In other words, it can be used to identify if there is a relationship in the presence of null values between each of the columns.
Values close to positive 1 indicate that the presence of null values in one column is correlated with the presence of null values in another column.
Values close to negative 1 indicate that the presence of null values in one column is anti-correlated with the presence of null values in another column. In other words, when null values are present in one column, there are data values present in the other column, and vice versa.
Values close to 0, indicate there is little to no relationship between the presence of null values in one column compared to another.
dendrogram plot
msno.dendrogram(df)
dendrogram is a tree-like graph generated through hierarchical clustering and groups together columns that have strong correlations in nullity.
If a number of columns are grouped together at level zero, then the presence of nulls in one of those columns is directly related to the presence or absence of nulls in the others columns. The more separated the columns in the tree, the less likely the null values can be correlated between the columns.

누락값 처리
data science관련 블로그에서 읽어본 포스팅에서 제안하는 방법들 중 몇가지를 정리해봤다:
1. drop 메소드
missing data의 유형이 MCAR인 경우, missing data가 있는 column을 삭제한다. 하지만, 이런 처리로 인해 데이터가 가진 정보가 손실될 수 있는 위험이 있다. 보통 특정 column의 값의 70~75% 이상이 missing이라면 column을 drop하는것이 적절할 수 있다.
만약 dataset이 매우 크고 데이터 전체에서 missing values의 proportion이 30% 미만이라면, missing values를 가진 rows를 삭제할 수도 있다. 하지만 데이터가 가진 정보에 영향을 끼칠 수 있는 위험이 존재한다. dataframe.dropna() 메서드를 사용해서 dataframe에서 누락값이 포함된 행 또는 열들을 삭제할 수 있다.
2. mean, median, mode로 교체
missing data를 해당 feature의 mean or median or mode 값으로 replace한다. 그러나 해당 feature의 variance를 감소시킬 수 있는 위험이 존재한다. 만약 데이터셋이 작다면 괜찮은 방법이긴 하다.
3. kNN(k nearest neighbor)
k-NN algorithm을 활용하는 방법이다. training dataset의 points과 가까운 resemblence를 기반으로 missing value에게 값을 assign하는 것이다. missing value와 근접한 observation에있는 observed data를 기반으로 적용 할 수 있다. 데이터 셋에 따라서 이방법이 mean, median, mode와의 교체 방법보다 더 정확할 수도, 더 불정확할 수도 있다. algorithm을 적용해야하는 방법이기 때문에 computational cost가 크고, training data set을 활용해야하기때문에 더 많은 용량을 차지할 수 있다.
4. MICE(Multiplee Imputation by Chained Equations)
missing data의 유형이 MAR인 경우 활용될 수 있는 방법이다. data set에서 missing data가있는 featuer이 아닌 다른 features를 사용해서 missing data의 값을 predict하는 것이다. 다른 feature의 값들로 만든 model(e.g., linear regression)을 통해서 missing value를 찾는다.
5. Miss Forest Imputation
2011년에 발표된 방법이고 다른 누락값 처리 방법(kNN, Mice, 등)보다 더 정확하다는 결과도 논문으로 발표된적이 있다고한다. 이 방법은 random forest imputation algorithm을 사용한다. 이 방법에서는 먼저 mean, median, mode 처리 방식 또는 random sampling imputation을 통해 missing values를 찾는다. 그 다음, 값이 있는 데이터들에 random forest를 fit해서 missing value를 예측한다. Random Forest Model을 값이 있는 데이터들을 통해 training 시키는 과정이 필요하다. 이 방법의 보다 더 정확하지만, computational cost나 처리 시간이 커지는 단점이 있다.
Training with incomplete dataset
참고논문: Processing of missing data by neural networks(2018) by Marek Smieja, Lukasz Struski
github: https://github.com/lstruski/Processing-of-missing-data-by-neural-networks
identifying every missing data point with a parametric density by modeling the uncertainty on missing attributes by probability density functions (direct completion(imputation) by single values를 하지않아도 되도록)
e.g. GMM
GMM is trained together with remaining network parameters. To process this probabilistic representation by neural network, we generalize the neuron’s response at the first hidden layer by taking its expected value. calculate the average neuron’s activation over the imputation drawn from missing data density.
References
- “Concepts of MCAR, MAR, and MNAR” from “Flexible Imputation of Missing Data” by Stef van Buuren https://stefvanbuuren.name/fimd/sec-MCAR.html
- https://ragvenderrawat.medium.com/miss-forest-imputaion-the-best-way-to-handle-missing-data-feature-engineering-techniques-2e6922e5cecb
- https://medium.com/analytics-vidhya/how-to-deal-with-missing-values-in-data-set-8e8f70ecf155
- https://towardsdatascience.com/general-guidelines-on-handling-missing-data-in-pandas-67e03a3e343c
- https://www.researchgate.net/post/Is-it-possible-to-train-a-neural-network-with-missing-data
- https://towardsdatascience.com/using-the-missingno-python-library-to-identify-and-visualise-missing-data-prior-to-machine-learning-34c8c5b5f009