CWT기반 Time-series Multiclass Classification
CWT(Continuous Wavelet Transform)와 CNN(Convolutional Neural Network)을 함께 사용해서 non-stationary multiple time series/ signals의 classification을 구현할 수 있다.
Signal data
stationary vs. non-stationary signal data
Stationary signal은 mean, variance and covariance가 시간이 흐름에따라 변하지 않는다. 이와는 반대로 non-stationary signal은 dynamic하게 변한다.
Fourier transform(FT)은 series of sine waves를 사용해서 시계열 signal 데이터를 frequency 데이터로 decompose해준다. 시계열 데이터를 frequency domain으로 transform 해준다.
Stationary signal을 FT(Fourier Transform)을 통해서 amplitude/strength of signal (as a function of time)으로부터 individual isolated frequencies in the frequency domain으로 변환된 결과를 다음 그림과 같이 표현할 수 있다. sinus waves같이 stationary process로 생성된 signal과 같은 경우에는 하나의 frequency로 signal을 표현할 수 있다.
Non-stationary signal은 실제 분석환경에서 encounter할만한 anomaly의 한 종류 또는 characteristic pattern일 수 있다. Non-stationary signal을 frequency domain으로 FT해보면 frequency 값을 찾을 수는 있지만, 어떤 frequency가 signal의 burst를 표현할 수 있을지 알 수 없다. FT는 signal을 frequency domain으로 decompose해주지만, 이 signal의 time domain 정보와 연결되지 못한다. 즉, FT이후 어떤 frequencies가 특정 moment in time의 signal에 포함되는지 알 수 없다. (or vice versa)
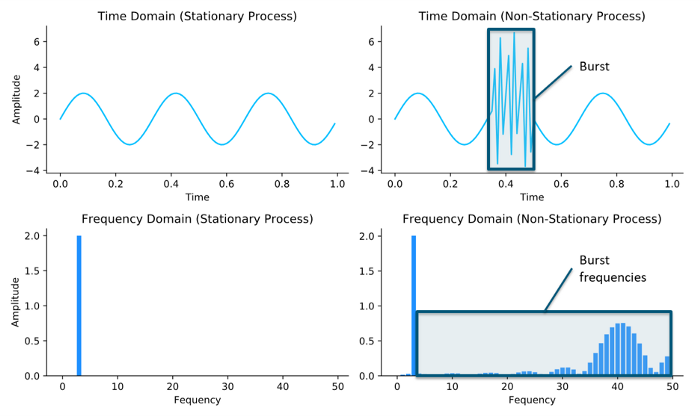
non-stationary signals가 FT를 통해 time 또는 frequency domain으로 confine되면 결국 signal의 complete 이해를 가지기 어렵다. 이런 상황을 개선하기위해 continuous wavelet transformation을 활용할 수 있다.
Continuous Wavelet Transformation
wavelet이란?
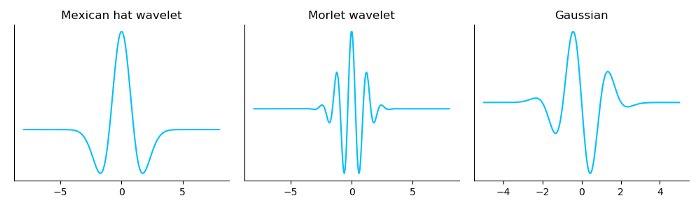
wavelet = mathematical functions that are often referred to as mini wavelets. zero mean을 가지고있고 시간내 제한되어있는 형태이다. (limited/finite in time). 그리고 다양한 families and types of wavelets가 있는데 각각 다른 compactness와 smoothness를 가지고있다.
각각 다른 wavelet shape을 보고 분석하려는 signal과 가장 best fit인 wavelet을 사용한다. CWT를 위한 대표적인 “mother wavelet”로는 Mexican hat, Morlet, Gaussian wavelet이 있다.
CWT의 wavelet transformation은 다음 공식과 같이 mother wavelet을 사용해서 1-D ~ n-D time series 데이터 또는 이미지 데이터를 scaled components로 나누어준다.
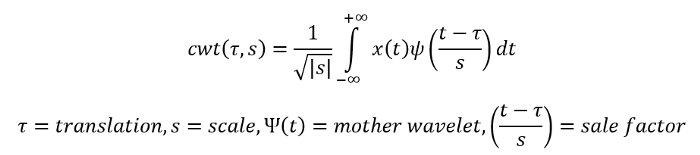
scaling과 shifting 이 두가지 concept을 활용한다.
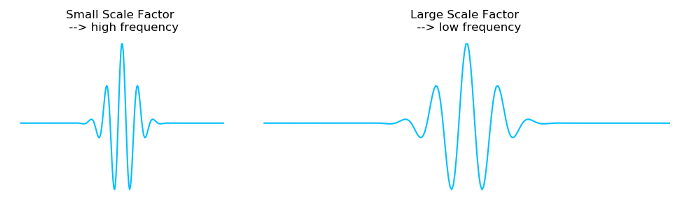
1) scaling : stretching/ shrinking the signal in time by scaling factor “how much a signal is scaled in time” frequency와 inversely proportional하다. 그래서 scaling factor가 클수록 higher frequency, scaling factor가 작을수록 lower frequency이다. stretched wavelet은 slow changes를 잡아내고, shrinked wavelet은 abrupt changes를 잡아낼 수 있다.
2) shifting : moving the differently-scaled wavelets from the beginning to the end of the signal
예) shrink and stretched Morlet mother wavelet in time
분석하려는 signal 전체를 따라 different wavelets(in scales and time)은 shift되고 sampling interval로 multiply되어서 physical significance를 얻을 수 있다. 결론적으로 wavelet scales와 shift parameter기반의 function으로 coefficient를 찾을 수 있다. (e.g., a signal with 100 timesteps multiplied by 32 scales results in 3,200 coefficients) 이런 방법을 통해서 CWT로 signal내의 oscillating behavior를 characterize할 수 있다.
위에서 보았던 non-stationary signal example에 CWT를 적용해보면 다음과 같이 scalogram으로 coefficients를 확인할 수 있다.
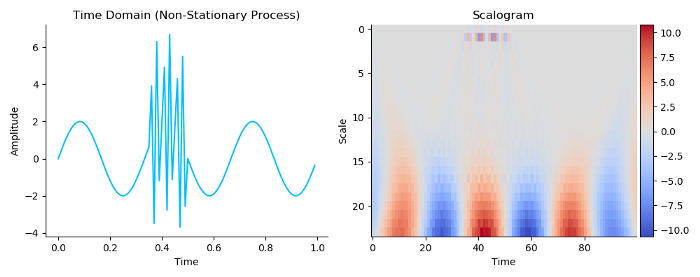
scalogram을 통해서 더 높은 resolution으로 signal의 characteristics가 표현된다. original signal의 에너지가 time과 frequency 어디에 가장 높은지를 확인할 수 있다. non-stationary signal에서 burst의 abrupt changes는 shrinked wavelet with scale 1 and 2를 통해 detect하고, slow changes는 stretched wavelet with scale 15~25를 통해 detect될 수 있다. 보통 shrinked wavelet으로 detect한 abrupt changes가 분석하는 사람이 찾고있는 characteristic인 경우가 많다.(e.g, anomaly detection, etc)
2D scalogram과 같이 CWT coefficients를 visualize하는 방법은 signal의 특징을 잡아내고 다른 types of signal을 구분할때에 유용하게 사용된다. 산업계에서는 differentiating between different production processes in a machine (process monitoring), bearing과 같은 부품의 condition monitoring, 또는 간단하게 quality monitoring, 등등을 모적으로 CWT가 활용된다.
Times series Classification through CWT
CWT는 1D time series를 2D coefficient로 변환시킨다. 이 coefficients는 signal의 time, frequency, characteristics를 표현해준다. 단순한 FT 또는 time series 데이터 형태일때보다 훨씬 더 많은 정보를 활용할 수 있다. 이런 정보에 담긴 pattern을 인식하고 학습해서 분류 모델을 생성할 수 있다.
HAR classification
smartphone sensor (accelerometer & gyroscope)의 데이터를 통해 HAR(Human Activity Recognition)을 구분할 수 있다.
target: 5 classes (walking, walking upstairs, walking downstairs, sitting, staying, laying)
features: 9 signals (body acc (x, y, z), body gyro (x, y, z), total acc (x, y, z))
open HAR dataset에는 7.5천 훈련 샘플, 2.9천 테스트 샘플이 있다. 각각의 샘플(measured instance)는 동일하게 128 readings and time steps로 fix되어있다.
X_train dataset shape: (7352, 128, 9)
X_test dataset shape: (2947, 128, 9)
데이터를 시계열로 plot해보면 dynamically changing 형태가 보여서 non-stationary signal로 파악할 수 있고, 이런 dynamical behavior를 기반으로 wavelet transformation을 적용하는것이 가능하다고 판단할 수 있다.
python으로 CWT를 구현하려면,
PyWavelets라는 python package를 다운받는다.
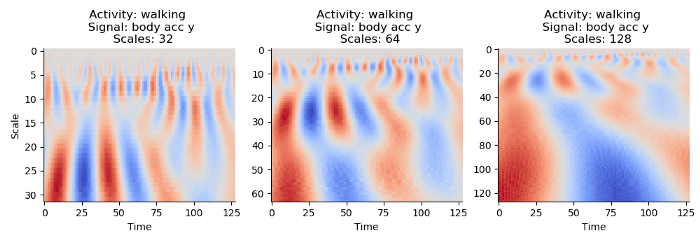
pip install PyWavelets또는conda install pywaveletscontinuous wavelet function pywt.cwt를 위해 적합한 mother wavelet과 scale size를 정의한다. (HAR data를 다룬 예시의 경우에는 가장 suitable shape을 가진 Morlet mother wavelet을 선택함.) 적절한 scale range size를 선택하기 위해서는 32, 64, 128을 고려해볼 수 있다. 일반적으로 smaller size scales(32, 즉 1~32)는 abrupt changes에 더 focus해서 signal의 anomaly의 발생과 같이 중요한 characteristics를 감지하고 판별할 수 있지만, 반면으로 wider size scales(64, 128)는 signal 내의 slow changes에 대한 특징을 더 정확하게 판단할 수 있다. Wider size scales는 분류모델의 더 높은 정확도를 줄 수 있지만, 이런 경우에는 deeper CNN 구조의 모델이 필요하다. (예시에서는 LeNet-5 구조의 CNN을 사용하고 scales: 64를 사용 함.)
scale range를 64로 설정 하고, 분류하려는 클래스별로 scalogram을 통해 CWT coefficients를 다음과 같이 각각 다른 특징을 가진 형태로 visualize할 수 있다.
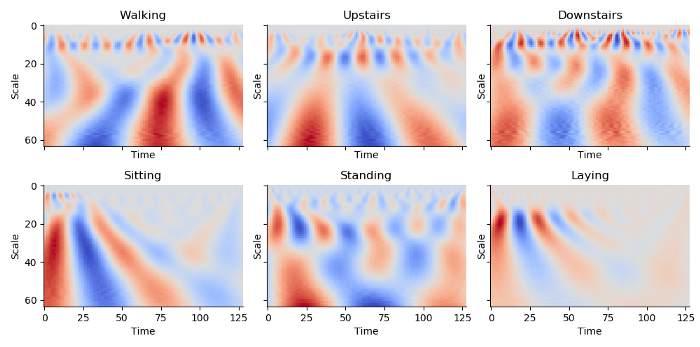
이 예시와 같이 HAR 데이터 셋을 사용한 경우에는 대략 1만개가 되는 데이터 샘플마다 9가지의 signal이 있기때문에, 각 signal에 CWT 적용한 visualization을 모두 살펴보고 human activity를 분류하기는 어렵다. 그래서 CNN과 같이 이미지를 분류할수 있는 neural network을 활용할 수 있다.
Pattern Detection using CNN
CNN 모델에 2D CWT coefficients를 image의 pixel과 같이 feed하여 signal의 정보를 학습하고 corresponding human activity를 분류하도록 한다. 이런 훈련 과정을 구현하기 위해서는,
HAR dataset의 signal을 pywt.cwt function을 통해 transform한다.
예시에서는 위에서 scalogram을 구현한것과 같이 Morlet mother wavelet을 활용하여 coefficients matrices를 생성했다. 원래 64 x 128 사이즈에서 64 x 64 size로 resize했다. (coefficients matrices의 resizing은 필수 단계는 아니지만, parameters와 computation resource를 save하기 위해서 필요한다.)
resulting coefficients를 “suitable format”으로 만든다.
먼저 CWT coefficient matrices를 CNN에 feed하는 방식을 정의한다. 9가지 signal들의 2D coefficients(이미지들)을 RGB image의 red, green blue channel들과 동일하게 합친다. 각각의 sensor signal data들의 dependencies를 동일하게 simultaneously 고려하기위해서이다. (만약 CWT coeffiients를 하나의 Numpy array image로 concatenate한다면 합쳐진 이미지들사이 boundary의 abrupt changes에 CNN 모델이 집중해버릴 수 있는 위험이 있다. 이런 noise를 방지하기 위해서 deeper CNN이 필요한 것이다.)
예시에서 활용한 architecture(LeNet-5 architecture with max pooling & ReLU activation):
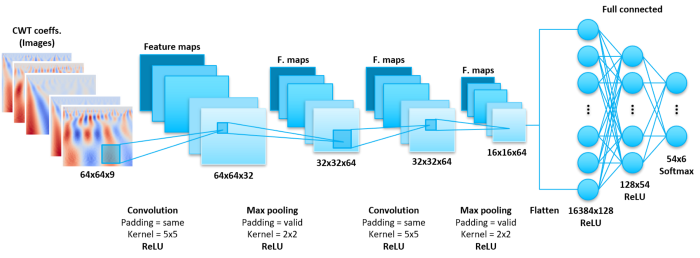
Average pooling보다 max pooling을 사용하면 extreme features(abrupt changes)가 더 잘 반영될 수 있음.
Hyperbolic tangent(Tanh)보다 ReLU activation은 vanish gradient problem을 완화할 수 있어서 훈련과정에 더 적합한 activation function임.
예시에서는 HAR dataset의 6 different activity classes를 분류하는데에 avg. 95% 수준의 accuracy를 확보했다. evaluation에서 confusion matrix를 확인해보면, HAR의 non-moving activity(staying, laying, sitting) vs. moving activity(walking, wakling upstairs, walking downstairs)의 구분에 약간 미흡한부분이 있지만, regularization이나 neurons의 추가 또는 hyperparameter tuning으로 개선이 가능할 것으로 예상된다.
References
Time Series Anomaly Detection using LSTM Autoencoders with PyTorch in Python by Curiousily(Venelin) https://curiousily.com/posts/time-series-anomaly-detection-using-lstm-autoencoder-with-pytorch-in-python/
https://github.com/curiousily/Getting-Things-Done-with-Pytorch/blob/master/06.time-series-anomaly-detection-ecg.ipynb
Multiple Time Series Classification by Using Continuous Wavelet Transformation by Sebastian Feike https://towardsdatascience.com/multiple-time-series-classification-by-using-continuous-wavelet-transformation-d29df97c0442