Gaussian Mixture Model
Why use Gaussian Mixture Model?
Clustering은 unsupervised machine learning의 기법 중 하나이다. Simple하게 각각의 sample을 단 하나의 cluster에 assign하는 K-means clustering algorithm은 “hard clustering”을 수행한다. 그러나 현실에서는 그렇게 무 자르듯 단면적인 정답만 존재하지 않는다. “Soft clustering”으로는 각각의 sample이 어느정도의 확률로 각 cluster에 assign될 수 있는지를 알수 있다.
예를 들어, 어떤 데이터셋의 sample들이 3개의 clusters (A, B, C)로 구분될 수 있다면, 특정 하나의 sample은 A cluster에 해당하는 확률 80%, B cluster에 해당하는 확률 15%, C cluster에 해당하는 확률 5%를 가질 수 있다. 이런 sample이 만약 “hard clustering” 방식이 적용되었다면, 단 하나의 cluster A에 해당한다는 답만 확인할 수 있을 것 이다.
데이터셋의 sample들의 clustering 속성을 조금 더 상세하게 들여다 보기위해서 “soft clustering” 방식과 같은 효과를 얻을 수 있는 방법이 Gaussian Mixture Model이다.
Gaussian Mixture
k개의 Gaussian distribution을 가진 mixture이다. k개의 cluster로 분류할 수 있는 데이터셋의 특성을 분석할 때에 활용할 수 있다. 각각의 Gaussian distribution은 다음과 같이 3개의 parameter로 표현될 수 있다:
- cluster의 중심을 의미하는 mean,
- distribution의 width를 의미하는 covariance
- Gaussian function이 얼마나 크고 작은지를 의미하는 mixing probability
예시) Given a dataset comprised of 3 Gaussians, Gussian functions를 다음과 같이 graph할 수 있다:
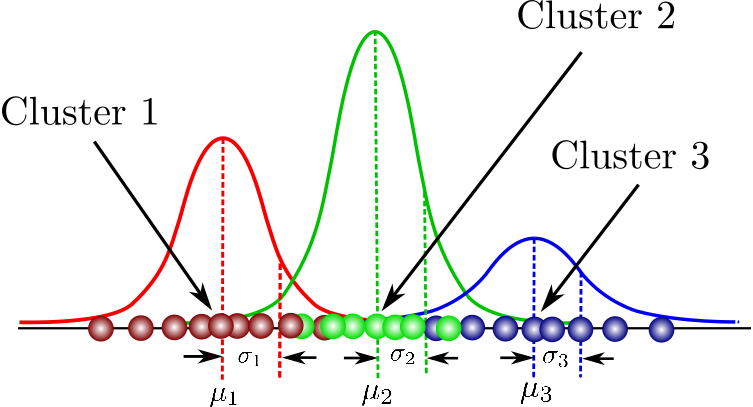
각 Gaussian function이 3개의 각 cluster안에 포함되는 data를 설명해준다. (K=3) 여기서 mixing coefficient는 확률 값으로서 각 cluster의 mixing coefficients를 모두 더하면 1이 된다.
위 parameter들의 최적의 값을 찾기 위해서는, need to ensure that each Gaussian fits the data points belonging to each cluster. (=maximum likelihood를 통해 할 수 있음.)
Gaussian density function:

x = data points
D = number of dimensions of each data point
mu = mean
sigma = covariance
(만약 데이터셋이 1000개의 3-Dimensional data points로 구성되어있다면, x는 1000x3 matrix, mu는 1x3 vector, sigma는 3x3 matrix일 것 이다.)
데이터셋이 주어진 x와 D를 입력한 후, if we differentiate the Gaussian density function with respect to the mean and covariance and equate it to zero, then 이 parameter들의 optimal values를 찾을 수 있을 것이다. (이 solution들은 Maximum Likelihood Estimates(MLE)에 해당할 것임.)
위 예시에서 보이는 바와 같이 여러개의 Gaussian이 존재한다면, 계산은 조금 더 복잡해질 수 있다.
What is the probability that the nth data point x_n comes from Gaussian k?
“Latent variable” z를 통해서 표현할 수 있다. z는 두 가지중 하나의 값만을 가질 수 있다. x가 Gaussian k에 해당한다면 1, 아니라면 0.
The overall probability of observing a point that comes from Gaussian k는 그 Gaussian의 mixing coefficient와 동일하다. Gaussian이 더 클수록 더 높은 확률을 예상하게 될것이기때문임.
그래서 총 K(=3)개의 latent variable z가 존재한다.
GMM(Gaussian Mixture Model)
데이터의 probability distribution을 기반으로 데이터를 각각의 categories로 분류할 수 있는 machine learning 알고리즘중 하나이다. Expectation과 Maximization으로 구성되는 iterative 방식의 EM 알고리즘을 통해서 최적의 GMM parameter를 찾을 수 있다.
References
- “Gaussian Mixture Models Explained” https://medium.com/towards-data-science/gaussian-mixture-models-explained-6986aaf5a95